Prepare For A Data Analytics Career
Students will learn how to apply statistical reasoning through hands-on training in the most widely-used tools, including Excel, Python, SQL, Tableau, and Power BI. Using real data from local companies in a variety of problem domains, such as healthcare, financial services, digital marketing, supply chain, and retail, students will gain practical experience in all stages of the analytics workflow. You will also learn to present your findings via presentations and storytelling, building reports, and creating dashboards.
Most of today's analytics positions now require technical skills. We believe that the Nashville area has an untapped supply of latent talent for data analytics jobs. But that talent needs access to accelerated, focused, real-world training. We’ve designed the Data Analytics Bootcamp to help address this need.
Program Highlights
- Part-time evening program that will meet two evenings a week and on Saturdays for a total of six months.
- Hands-on training in spreadsheets, Python, and SQL skills required to do data analytics.
- Application of the analytics workflow to real-world problems drawn from a wide range of problem domains, such as: digital marketing, supply chain, healthcare, retail and financial services.
- Hands-on experience communicating your findings via presentations and storytelling, building reports, and creating dashboards.
Forbes Advisor
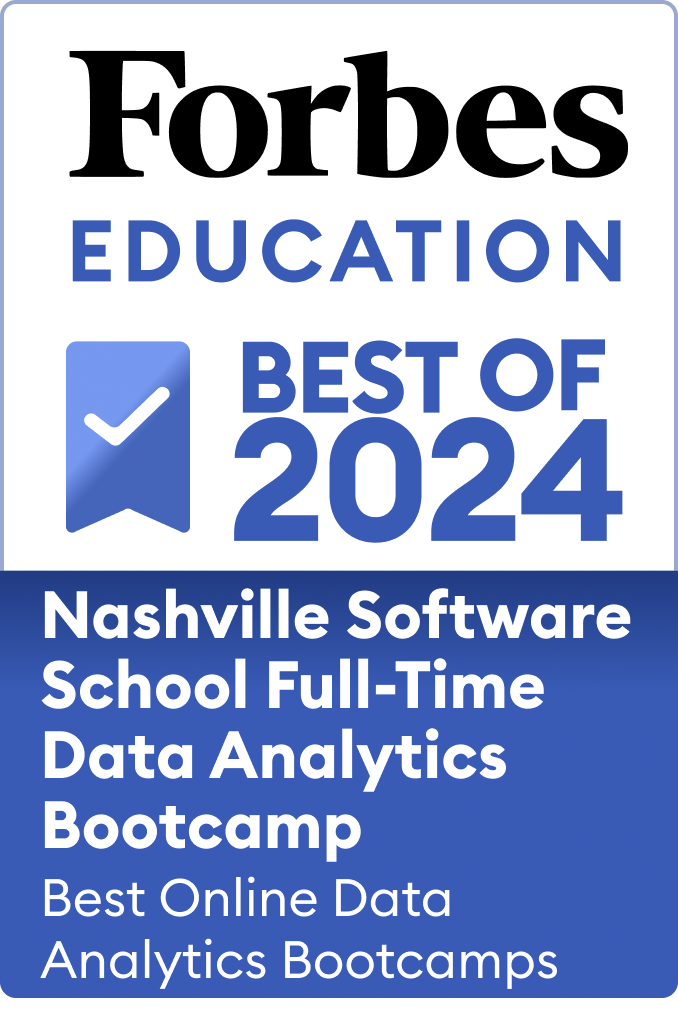
Forbes Advisor selected NSS's Full-time Data Analytics Bootcamp as one of the best Data Analytics Bootcamps in the U.S. and best for students on a budget. Our Part-time Data Analytics Bootcamps uses the same curriculum, just on a different schedule, and has the same cost. Learn more.
Attend our virtual information session on the 3rd Wednesday of every month at 5:30 p.m.
What You Will Learn
-
Python
You will learn to use Python in Jupyter Notebooks to create and document an analytics workflow. You will learn to read, clean, process, explore, and visualize data using the most prevalent libraries for data analysis. -
Spreadsheets
Spreadsheets are the number one tool used by businesses to gain insights from their data. You will learn to transform data; use logic, conditionals, and formulas to create new data values; and generate statistical information. You will get practice building charts and working with add-ins like power pivot. -
SQL
You will get practice querying, joining, and aggregating data with SQL. You will learn about the differences between relational databases, NoSQL databases, and dimensional models, along with some of the common challenges that businesses face when storing and using data in a SQL database. -
Analytics Workflow
You will study the stages of the analytics workflow, including getting data, using Extract-Transform-Load (ETL) processes to store data for optimum use, analyzing data, and creating reports and dashboards. You will get practice with the tasks at each stage to understand how they work together in support of delivering actionable insights. -
Exploratory Data Analysis
Understanding your data well is a prerequisite to using it effectively. You will learn and practice exploratory techniques to understand and describe your data, including generating plots and summaries. -
Communication, Dashboards, and Reports
You will learn to communicate your findings via presentation and storytelling, building reports, and creating dashboards. You will learn to evaluate findings for their business value and to target your audience with empathy (understanding what they want). Data visualization tools include Tableau and Power BI. -
Real-World Projects
You will be able to apply the skills you are learning to real-world datasets and problems from various domains, such as healthcare, financial services, entertainment, consumer marketing/retail, and government. Projects will be executed primarily in a team environment so you experience working with others on a multi-disciplinary project team.
Your capstone project will be an individual effort that demonstrates your ability to take a problem through the entire data analytics workflow. This project will demonstrate to potential employers your ability to apply the skills learned in this class to a real-world problem and present your findings. -
Career Preparation
Throughout the bootcamp you will also be preparing to move into a data analytics job. You’ll meet working data analysts from several industries. We’ll hold workshops on resume preparation/marketing yourself, interview preparation, negotiating, and more. And we’ll introduce you to prospective employers at your class Demo Day and support you during your job search after graduation. -
Learn To Work On A Remote Team
NSS’s live online experience prepares you to work with teams remotely. You’ll learn to communicate in a remote environment through virtual interactions with your instructors and classmates on Zoom, asynchronous communication tools like Slack, and written code reviews with Git and GitHub. -
Post-graduation Support
Our support doesn’t stop at graduation. Our career development team will continue to work closely with you during your search for your first job in tech. We’ll share job postings that we receive from employers looking to hire NSS graduates. You’ll be invited to weekly job search support sessions that cover everything from technical refreshers to interview prep and peer connection. We’ll connect you with community resources like Code Campfire and meetup groups. And you will have access to available seats in our continuing education courses to keep building skills while you search.
-
Schedule
Tuesday, Thursday, Saturday T/Th: 6PM - 9:30PM CT | S: 9AM-2PM CT -
Location
This class is live online (i.e. synchronous).
-
Dates
-January 26 - July 22, 2027
-
Tuition
$7,875
See below for detailed information on payment options, including Opportunity Tuition, Payment Plans, and Financing.